Retail key performance indicators (KPIs) are available in a series of interactive visualizations on the SoundCommerce Retail Platform dashboards. Each dashboard section focuses on a functional area of your retail operation (such as Marketing, Operations). Your subscription level (Campaign, Customer, etc.) and data determine which sections are populated in the dashboard.
By interacting with views and filters, you can quickly compare orders by time period, product line, and campaign. For additional KPIs, run customized SQL queries in Direct Access. Your Direct Access data is stored in a BigQuery project in the Google Cloud data warehouse.
This article gives you a quick tour through each of the dashboard features.
In this article
- Navigate the dashboards
- Interact with charts
- Apply a filter to modify chart views
- Share and export charts or data sets
- Check data freshness
- Look up terms in the Data Dictionary
Navigate the dashboards
- From the left pane, select the dashboard you want to view.
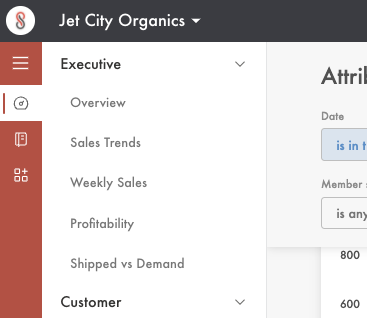
Note: Your SoundCommerce subscription determines which dashboards are available to you. Contact your representative for details.
Interact with charts
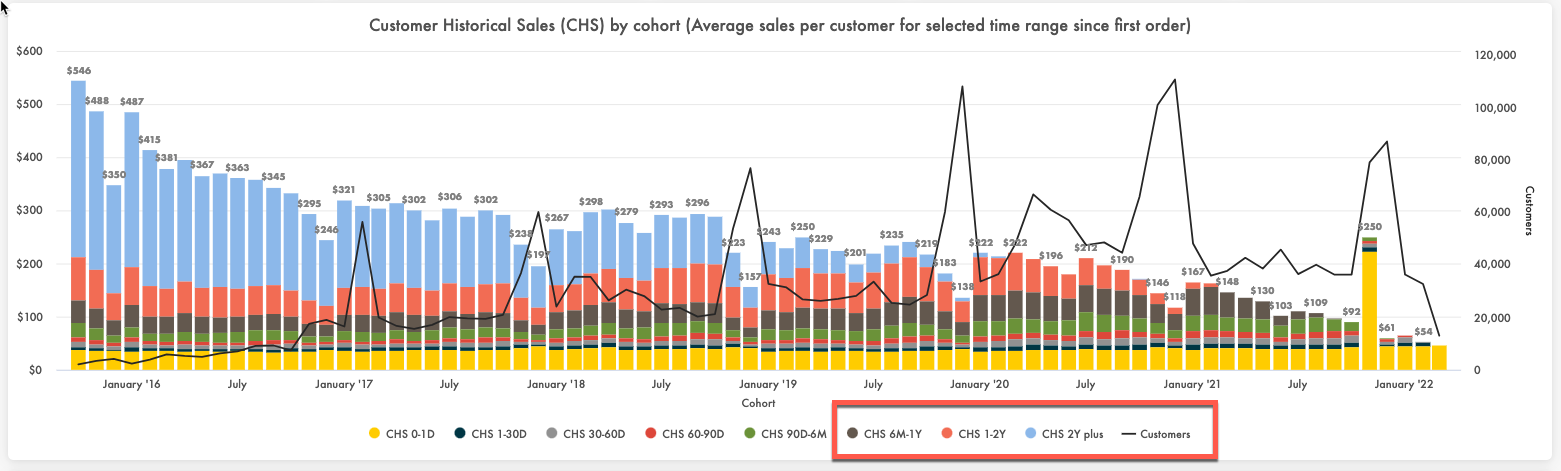
You can interact with many of the elements in a chart to change what's being shown. The following screenshot below shows the historic sales of cohorts for specific time periods, from January 2016 through January 2022.
- If we only want to see cohorts from the past 6 months, select the buttons outlined in red. These buttons will appear dimmed, indicating that this data is now hidden from the visualization.
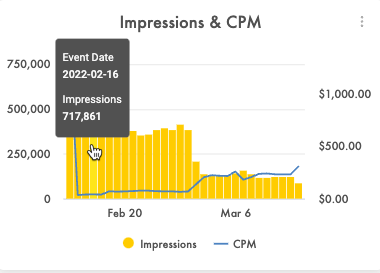
- Hover over an element of a bar chart to get more details in a tooltip.
Apply a filter to modify chart views
Filters appear at the top of each view and show the specific metrics in the visualization. Because different data sets are showcased in each dashboard, filter options will change to reflect the attributes and properties of those data sets.
Note: Each time you change the filter, a SQL query with your new selection runs on the underlying database. It can take a few minutes for the dashboards to update.
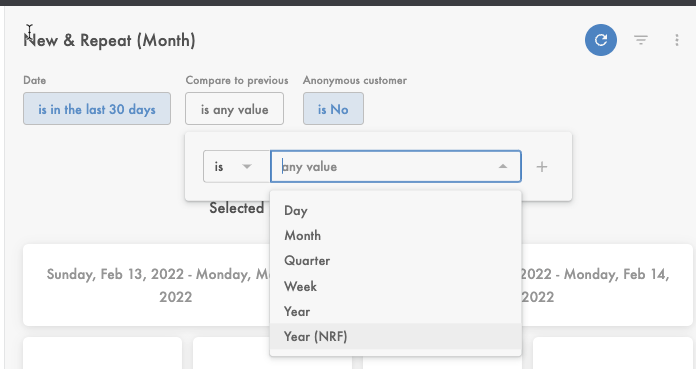
- To apply a new filter, click the blue box that holds the parameter you want to change.
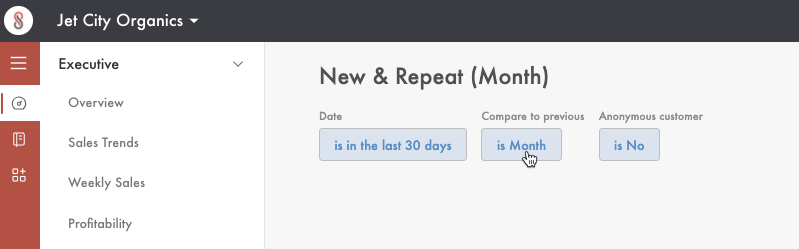
- Click in a field to select a different parameter from the drop-down menu. If you want to add more parameters, select the plus sign (+).
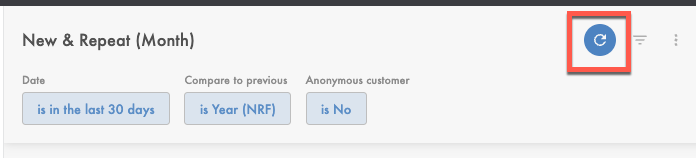
- To save your filter as the new default, select the Update button (highlighted in the screenshot below). Your changes will persist after you close the dashboards.
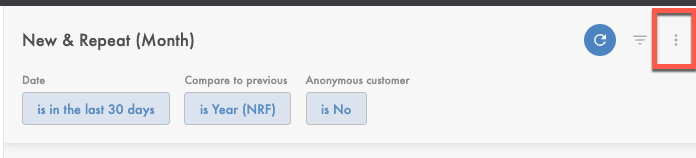
- To return the dashboards to the original defaults, select the Dashboard actions button.
[Back to top]
Share charts and data sets
You can save any of the dashboard views to your local computer, send them in email, or set up a schedule to have views delivered to your inbox.
- From a chart, select the vertical ellipses
 in the upper-right corner to download the data sets
 - From a dashboard view, select the gear icon
 in the upper-right corner to send or export the view to a PDF, .csv zip, or .xlsx file
Note: Views you save to the browser (that is, on the SoundCommerce.io site) are removed after 3 days.
Check data freshness
You can quickly check on your data sources to ensure that dashboards are showing all of your data and that it's up-to-date.
- Scroll to the bottom of the browser window and check the Last data refresh status

- Select Data Platform to see a complete list of all active data sources.

The Data Monitor shows you the status of every data source that uses API calls to make the connection. Data that's ingested from files are not represented here. When a source collector checks for new data, the status changes to Running.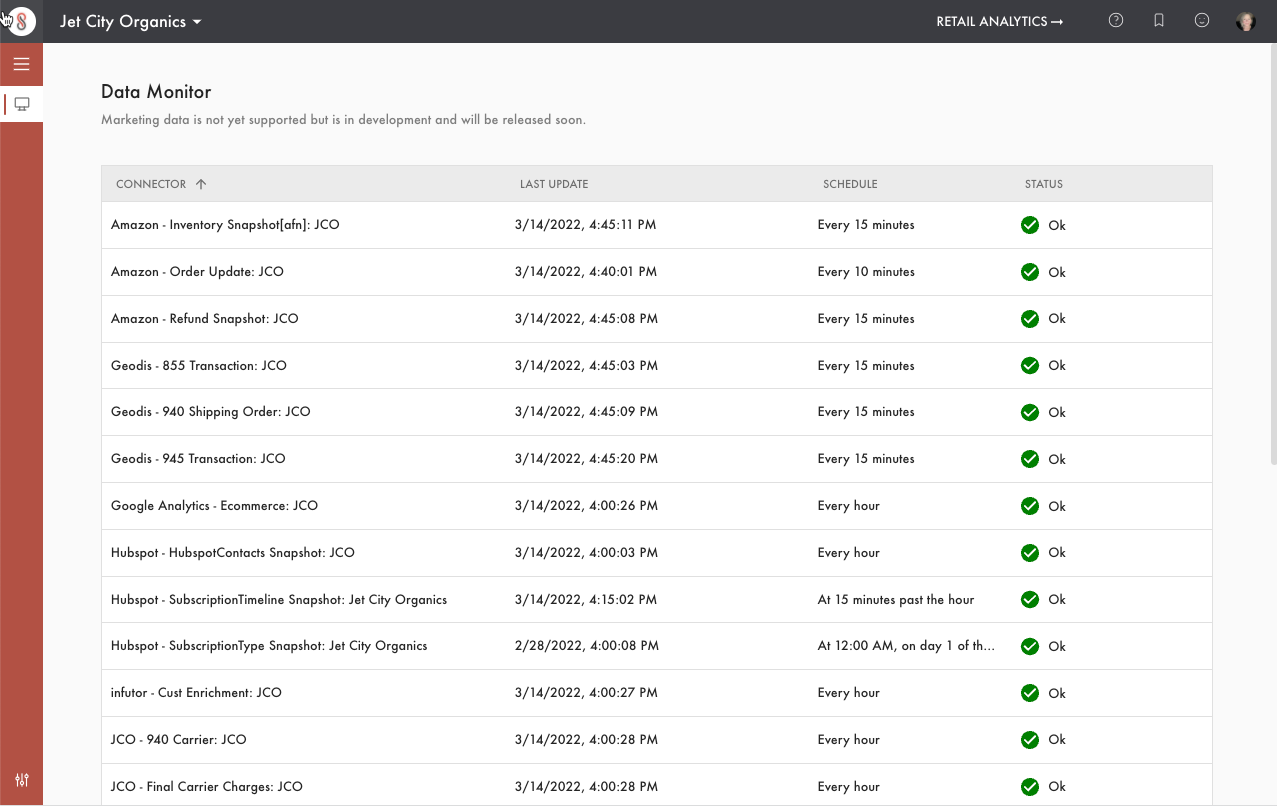
- To return to the dashboard views, select Retail Analytics.
[Back to top]
Look up terms in the Data Dictionary
The Data Dictionary includes terminology and formulas depicted in the dashboard KPIs, as these can often vary in the e-commerce and digital marketing sectors.
- To open the data dictionary, from the left navigation pane, select Data Dictionary
- To look up a single term in a dashboard, hover over the label or click the Info ( i ) button
[Back to top]
Related articles
Get started with Query Builder
Get customer insights
Get marketing insights
Look up dashboard terms in the Data Dictionary
Comments
0 comments
Please sign in to leave a comment.