This article explains the methodologies we used to build customer segments for the Customer Lifetime Value (CLV) and Customer Lifetime Sales (CLS) data models. Each of these data models include six segments to help retailers understand where customers fall on the spectrum of lifetime value, lifetime sales, and predicted profit and sales.
The predictive metrics of the CLV and CLS data models are calculated for each customer record (CUID) using a machine-learning regression model. K-means is a widely-accepted machine learning tactic used to group similar data points to discover underlying patterns. Therefore, we use the k-means algorithm to group or "cluster" our derived data points by finding a central point or "centroid" that is the minimum average distance for all of the data points.
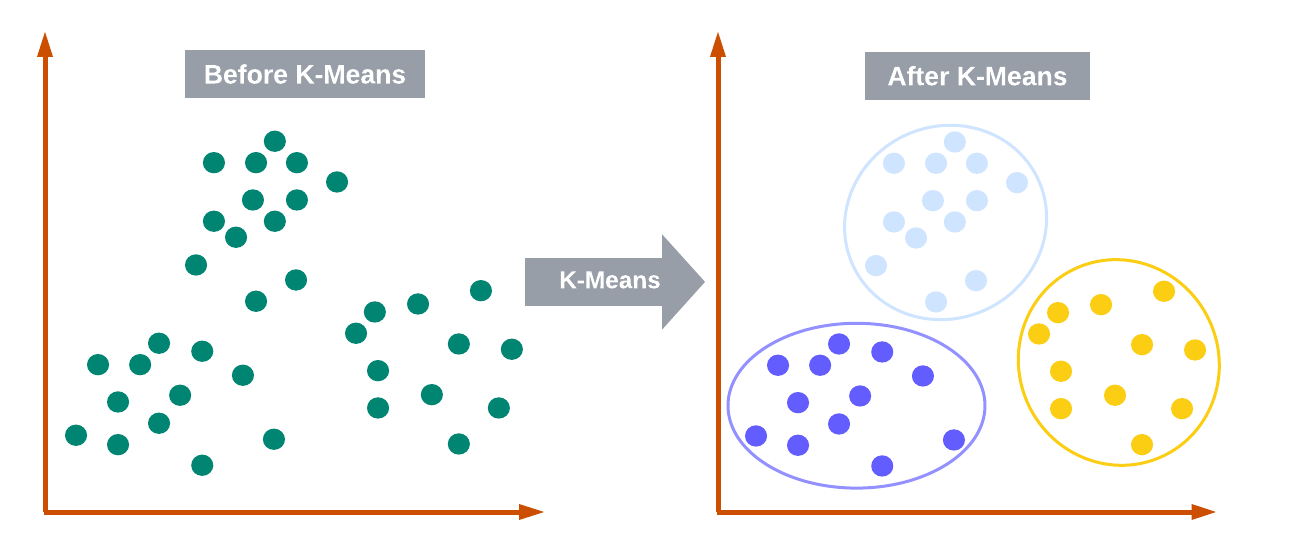
.png&size=22026&height=251&width=584&alt=) This results in three segments that contain customers with similar spending habits and lifetime value. Clustering lets us communicate key metrics (specifically mean, median, standard deviation, and accuracy) that are associated with each segment. All of these metrics are deeply insightful in understanding the CLV of a customer base.
This results in three segments that contain customers with similar spending habits and lifetime value. Clustering lets us communicate key metrics (specifically mean, median, standard deviation, and accuracy) that are associated with each segment. All of these metrics are deeply insightful in understanding the CLV of a customer base.To determine the optimal number of clusters (k) for a specific dataset, we used the elbow method—the primary method used by statisticians and data scientists. This method allows us to measure which number of clusters will minimize the sum of squared distances (SSE) across each cluster. In other words, we can choose the number of clusters that minimizes overall deviation from the centroids of each cluster. Our findings indicate that either three or four clusters is an optimal number. We chose three because it is the simplest to understand from a customer segmentation perspective (Low, Medium, or High).
We define segments differently for every SoundCommerce client, because no two businesses are alike. Nor will they have the same CLV, due to differences in repeat purchase propensity, AOV, and average customer lifetime. These factors are highly variable across industries and businesses.
A distinct benefit of k-means clustering is that clusters are defined by the data. This means that instead of choosing arbitrary ranges for each segment (for example, dollar ranges of $0-$100, $101-$200, and $201-$300), k-means chooses ranges that are specific to a customer’s business.
Comments
0 comments
Please sign in to leave a comment.