Customer lifetime sales (CLS) measures the impact that acquiring a new customer has on demand sales over the lifetime of that customer. CLS is often used as an alternative to customer lifetime value (CLV), if cost data isn’t available.
Since marketers are often evaluated on their ability to drive sales, it's essential to know which marketing channels and strategies deliver the highest CLS outcomes.
In this article:
Data requirements
The CLS data model is included in the following modules:
-
SoundCommerce Campaign
-
SoundCommerce Customer
How we define CLS
Customer Lifetime Sales (CLS) represents the revenue that a customer generates over the entire lifetime of that customer, where a customer lifetime is defined as the time between their first purchase and churn.
SoundCommerce tracks CLS for individual customer records (CUIDs), which can then be averaged over customer segments. CLS can help marketers decide which channels, products, and customers to focus acquisition and retention efforts on.
CLS for each unique customer record (CUID) is defined as the sum of a historic sales and predicted future sales.
Customer Current CHS (Customer Historic Sales) is the sum of demand sales across all existing orders, where demand sales = booked sales minus cancellations and discounts.
Customer Predicted Sales is the sum of demand sales across orders that the customer is expected to make in the next 12 months.
Direct Access Fields
| Data Kind | Direct Access Field | Data Type | Description |
| Customer | CLS | Numeric | CHS plus predicted discounted sales for the next 12 months |
| Customer | CLS_segment | String | Low, Medium, or High (Output of k-means clustering using single dimension of CLS) |
| Customer | predicted_sales | Numeric | Predicted discounted sales for next 12 months (updated daily) |
| Customer | predicted_sales_segment | String | Low, Medium, or High (Output of k-means clustering using single dimension of predicted_sales) |
|
Customer |
CLS_accuracy |
Numeric |
Accuracy of the CLS segment assigned to the customer; segment accuracy is defined as number of correct predictions over total predictions |
|
Customer |
sales_accuracy |
Numeric |
Accuracy of the predicted sales segment assigned to the customer; segment accuracy is defined as number of correct predictions over total predictions |
Predictive metrics
Demand sales predictions are calculated for each customer record (CUID) through a machine-learning regression model. By analyzing three years of historical order and cost data, the CLS model can predict demand sales for the next 12 months.
Sales predictions associated with any predictive model are most accurate when applied as an average across several customers. Applied to individual customers, predictive sales metrics sometimes miss the mark by over or under predicting sales.
By measuring the average CLS and predicted sales across all CUIDs in a segment, you can dramatically improve the accuracy of your sales predictions. For example, if predictive metrics tell us that cuid_1119 has a CLS of $50, the customer's actual CLS may end up above or below this threshold. While we can't predict the CLS for cuid_1119 with absolute certainty, we can analyze several customers who are similar to cuid_1119, and reliably predict their collective CLS to be $40-60.
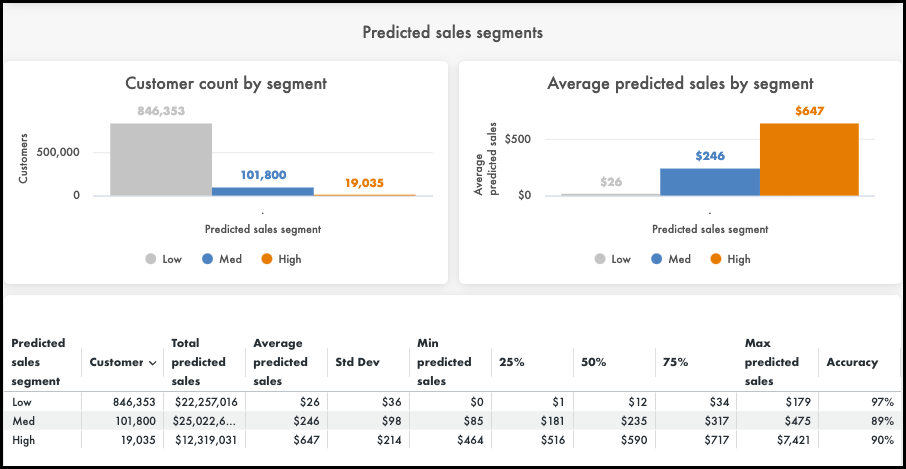
Quicker results with segments
To provide quicker insights as to where customers fall on the spectrum of predicted sales and lifetime sales, we've provided six pre-built customer segments. Each segment uses k-means clustering to aggregate customers into groups of Low, Medium, or High, for both CLS and predicted sales, based on their individual data. We explain this process in How segments are built with k-means clustering.
From the CLS dashboard, you can see how many low CLS customers you have compared to high CLS customers and how segments are defined in terms of sales. From there, you can take immediate action in Query Builder to investigate causes of low CLS and target these customers through email or SMS marketing campaigns. Find descriptions for pre-built CLS queries in the Query Library.
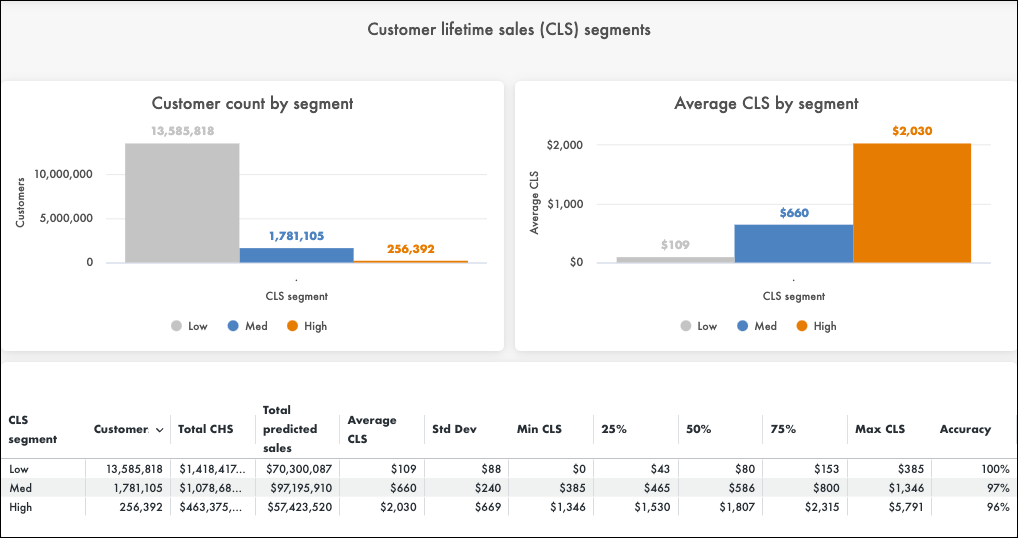
How accurate are CLS segments?
Each pre-built segment includes an accuracy metric that tells you, of the customers predicted to fall in a segment, how many actually landed in that segment. Therefore, accuracy is defined as the percentage of correct predictions divided by the total number of predictions.
For an example of accuracy metrics, we can look at the Low predicted profit segment for our fictional retailer, Jet City Organics. On June 17, 2022, the accuracy of the Low predicted sales segment was 97%. This tells us that 97 out of every 100 customers who were predicted to have Low sales a year ago actually fell in the low range.

 Directly below the graphs, you’ll find the accuracy rating ( % ) for each segment (Low, Medium, High). Predicted demand sales is typically more accurate for segments versus individual customer IDs.
Keep in mind that the accuracy metric will fluctuate. This is because the dataset we use to generate predictions updates on a daily basis.
Related topics
Dashboard: Customer lifetime sales (CLS)
To run pre-built CLS queries in Query Builder, see the Query Library
Comments
0 comments
Please sign in to leave a comment.